Welcome!

By registering with us, you'll be able to discuss, share and private message with other members of our community.

SignUp Now!

Sounds, signals and software: A Crootn deepdive

shiv

John
Administrator
Founder
Member
Joined
Dec 1, 2020
Messages
13,741
I really appreciate everyone's contributions to the forum. Love the threads from @Nape and the owl thread from @Sloppy Mexican

The board might not move as fast as the main board, but I feel like the content quality here has been off the charts.

I want to contribute something that is personal to me and maybe I can help some peeps on here learn something. It might bore your socks off, but bear with me and I think I can make it where people can understand some science things a bit better

I really want to try and demystify this shit right here:
1612890744838.png
 

shiv

John
Administrator
Founder
Member
Joined
Dec 1, 2020
Messages
13,741
Sounds provide a very good analog that we can learn how they work and then scale them up to something like electromagnetic fields.

Sounds are basically pressure waves. We use our voice box (or any other medium) to vibrate the air. Those vibrations propagate through the air around us, and can be received by other things (like our ears, or a microphone) that have something that can be vibrated by the pressure wave, and convert the wave to information.

Don't overthink it too much yet.

But let's understand how a microphone works. Basically, a sound vibrates a pressure plate and that vibration is converted to a voltage signal.
 
Last edited:

shiv

John
Administrator
Founder
Member
Joined
Dec 1, 2020
Messages
13,741
Here is some code I wrote in matlab. The lines that start with % are comments that try and describe what the lines below do:

%the code right here just leverages a matlab toolbox so I can use the
%speaker on my headset to capture data from my voice

s = daq.createSession('directsound');
addAudioInputChannel(s,'Audio1','1','Audio')


%tf is the time that the computer will be acquiting data while I speak
tf = 1;
s.DurationInSeconds = tf;


%this section gives me a note on the screen when the computer is
%collecting data, and another message when the collection is over

disp('Starting foreground acquisition');
data = startForeground(s);
disp('Foreground acquisition finished');


%all I am doing here is plotting the vibration of the air created by my
%voice with respect to time

figure;
t = linspace(0,tf,length(data));
h = plot(t,data);
xlabel('Time (s)')
ylabel('|Y(f)|')
grid on;


%Here is a plot that shows the fourier transform of the data. The fourier
%transform converts time domain to frequency domain. Don't think about it too much,
%but basically I can convert the above signal and see what specific
%frequencies are in there

fft_data = fft(data);
figure;plot(abs(fft_data)*1/s.Rate);
xlim([0 10000]);
grid on;
 

shiv

John
Administrator
Founder
Member
Joined
Dec 1, 2020
Messages
13,741
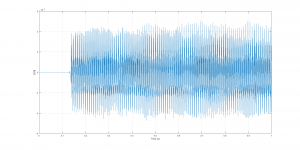
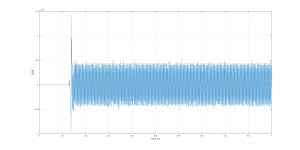
I recorded myself making two kinds of sounds. I attempted to make a "low" frequency sound with a deep voice, and then a "high" frequency sound with a high pitched voice.

Below are the plots with respect to time. The low frequency sound is on the top, and the high frequency sound is on the bottom.

These are plots of the vibrations of the air over time.

You will notice that the vibrations are spaced further apart on the low frequency plot (slower vibrations), and closer together on the high frequency plot (faster vibrations)

Low frequency sound versus time:
1612892041852.png

High frequency sound versus time:
1612892066662.png
 

Peach-head

Poster
Joined
Jan 8, 2021
Messages
221
Here is some code I wrote in matlab. The lines that start with % are comments that try and describe what the lines below do:

%the code right here just leverages a matlab toolbox so I can use the
%speaker on my headset to capture data from my voice

s = daq.createSession('directsound');
addAudioInputChannel(s,'Audio1','1','Audio')


%tf is the time that the computer will be acquiting data while I speak
tf = 1;
s.DurationInSeconds = tf;


%this section gives me a note on the screen when the computer is
%collecting data, and another message when the collection is over

disp('Starting foreground acquisition');
data = startForeground(s);
disp('Foreground acquisition finished');


%all I am doing here is plotting the vibration of the air created by my
%voice with respect to time

figure;
t = linspace(0,tf,length(data));
h = plot(t,data);
xlabel('Time (s)')
ylabel('|Y(f)|')
grid on;


%Here is a plot that shows the fourier transform of the data. The fourier
%transform converts time domain to frequency domain. Don't think about it too much,
%but basically I can convert the above signal and see what specific
%frequencies are in there

fft_data = fft(data);
figure;plot(abs(fft_data)*1/s.Rate);
xlim([0 10000]);
grid on;

Bruh. I remember matlab. Making me nostalgic over here.
 

LVRebel

GIF specialist
Founder
Member
Joined
Dec 9, 2020
Messages
2,968
I recorded myself making two kinds of sounds. I attempted to make a "low" frequency sound with a deep voice, and then a "high" frequency sound with a high pitched voice.

Below are the plots with respect to time. The low frequency sound is on the top, and the high frequency sound is on the bottom.

These are plots of the vibrations of the air over time.

You will notice that the vibrations are spaced further apart on the low frequency plot (slower vibrations), and closer together on the high frequency plot (faster vibrations)

Low frequency sound versus time:
View attachment 6144

High frequency sound versus time:
View attachment 6145
That's pretty cool!
 

shiv

John
Administrator
Founder
Member
Joined
Dec 1, 2020
Messages
13,741
That's pretty cool!
But wait, there's more.

We can extract a lot more information from the signal if we look at it a different way. There is something we can apply to the data called a fourier transform (a discrete fast fourier transform (FFT) in our case, but that's not really important)

Fourier transforms convert a time domain signal into the frequency domain - the x-axis of the plots will no longer be time, but rather frequency. It is just a mathematical operation applied on a set of data. You really don't have to understand how it works, just that it does work.

In a sec I'll show what the signals above look like after a fourier transform is applied.

1612893857052.png
 

bigassmoney

Poster
Founder
Joined
Jan 9, 2021
Messages
122
fbd.jpg
 

shiv

John
Administrator
Founder
Member
Joined
Dec 1, 2020
Messages
13,741
Now let's look at the plots of the low frequency and high frequency signals that have been transformed to the frequency domain

I put individual data markers on some of the peaks to show frequencies that had the largest contribution to these sounds.

You are concerned with the x-value on the data markers (x value is the frequency) the y value is the amplitude (or intensity) and we aren't really trying to dig into amplitude data in this example

Low Frequency (dominated by 114 Hz, 340 Hz, 903 Hz as well as a couple others I didn't mark)
1612894423126.png

High Frequency (dominated by 400 Hz, 3237 Hz, 3607 Hz, 4370 Hz as well as a couple others I didn't mark)
1612894516949.png
 

shiv

John
Administrator
Founder
Member
Joined
Dec 1, 2020
Messages
13,741
Now, the final experiment.

I played this youtube video over my speakers and let me headset mic record the data in Matlab:


Here are the plots that resulted from my Matlab script:

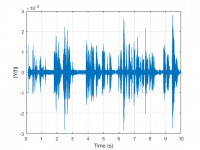
Time Domain
1612895224072.png

Frequency domain:
1612895255850.png

You will see that the plot in the frequency domain shows a very clearly dominant tone at 397 hertz.

Not exactly 396, but that tiny difference can likely be attributed to uncalibrated equipment
 

shiv

John
Administrator
Founder
Member
Joined
Dec 1, 2020
Messages
13,741
I love Tesla and envy your brain
Appreciate it man. I fully intend on using it (along with the brains of a couple other autistic technophiles) to become the technical spearhead for the movement that started this forum.

We will just clear the way, and hopefully some of the more charismatic folks will step up
 

Jayhacker

Legendary
Founder
Member
Joined
Jan 9, 2021
Messages
5,707
I recorded myself making two kinds of sounds. I attempted to make a "low" frequency sound with a deep voice, and then a "high" frequency sound with a high pitched voice.

Below are the plots with respect to time. The low frequency sound is on the top, and the high frequency sound is on the bottom.

These are plots of the vibrations of the air over time.

You will notice that the vibrations are spaced further apart on the low frequency plot (slower vibrations), and closer together on the high frequency plot (faster vibrations)

Low frequency sound versus time:
View attachment 6144

High frequency sound versus time:
View attachment 6145
Can you do one of a Maxine Waters speech?
 

shiv

John
Administrator
Founder
Member
Joined
Dec 1, 2020
Messages
13,741
Can you do one of a Maxine Waters speech?
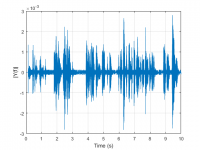
I lowered the frequency of it and saved it to soundcloud:


You can see the similarities along the bottom of the soundcloud player to the plot below:

1612905191387.png
 
Last edited:

shiv

John
Administrator
Founder
Member
Joined
Dec 1, 2020
Messages
13,741
Also, I mathematically recreated twinkle twinkle little star

Turn your speakers down before you play cause it plays loud as shit


120north

Elite
Founder
Joined
Dec 9, 2020
Messages
186
Did some work with patching holes in time series data by using FFT a LOOOOONNNNGGGG time ago. We needed continuous data for a hydrodynamic model and there couldn't be any gaps as it would destroy the harmonics (tidal signal) in the system. Thought I would never have to see that again. I used to have all of my FORTRAN source code on floppy disks at my parents house. I have no idea what happened.

This is the first I have seen about Solfeggio frequencies. Interesting. I would assume that because everything has light and dark, that there are frequencies that do the opposite. Bet we you could filter and FFT media to see if those were present and were intended to cause destablizing effects at the subconscious level to magnify your emotions at hearing it.
 

shiv

John
Administrator
Founder
Member
Joined
Dec 1, 2020
Messages
13,741
Did some work with patching holes in time series data by using FFT a LOOOOONNNNGGGG time ago. We needed continuous data for a hydrodynamic model and there couldn't be any gaps as it would destroy the harmonics (tidal signal) in the system. Thought I would never have to see that again. I used to have all of my FORTRAN source code on floppy disks at my parents house. I have no idea what happened.

This is the first I have seen about Solfeggio frequencies. Interesting. I would assume that because everything has light and dark, that there are frequencies that do the opposite. Bet we you could filter and FFT media to see if those were present and were intended to cause destablizing effects at the subconscious level to magnify your emotions at hearing it.
Yup
 

shiv

John
Administrator
Founder
Member
Joined
Dec 1, 2020
Messages
13,741
Did some work with patching holes in time series data by using FFT a LOOOOONNNNGGGG time ago. We needed continuous data for a hydrodynamic model and there couldn't be any gaps as it would destroy the harmonics (tidal signal) in the system. Thought I would never have to see that again. I used to have all of my FORTRAN source code on floppy disks at my parents house. I have no idea what happened.

This is the first I have seen about Solfeggio frequencies. Interesting. I would assume that because everything has light and dark, that there are frequencies that do the opposite. Bet we you could filter and FFT media to see if those were present and were intended to cause destablizing effects at the subconscious level to magnify your emotions at hearing it.
Not just sound, but also (see the bottom paragraph below)

Note it says very low intensity

1612911626661.jpeg
 

Simmer007

Poster
Founder
Joined
Jan 9, 2021
Messages
286
I really appreciate everyone's contributions to the forum. Love the threads from @Nape and the owl thread from @Sloppy Mexican

The board might not move as fast as the main board, but I feel like the content quality here has been off the charts.

I want to contribute something that is personal to me and maybe I can help some peeps on here learn something. It might bore your socks off, but bear with me and I think I can make it where people can understand some science things a bit better

I really want to try and demystify this shit right here:

View attachment 6143
just watched a doc on tesla on amazon prime yesterday, what a genius, and retard
 

shiv

John
Administrator
Founder
Member
Joined
Dec 1, 2020
Messages
13,741
Also, I mathematically recreated twinkle twinkle little star

Turn your speakers down before you play cause it plays loud as shit

If you guys could understand a bit how this works, you would have a rough idea how radar waveforms are generated - specifically frequency modulated waveforms.

I basically just used this code right here to make a sin wave at a specific frequency (according to the note in twinkle twinkle little star)

f=396;
t = 0:0.00005:1;
y = sin(2*pi*f*t);

f would be the frequency of the musical note:


And then you just do one note at a time and then append the sine waves together
 

Hoppo

Elite
Founder
Joined
Jan 12, 2021
Messages
896
This brings back some memories. I used to work for a speech analytics company. I don't miss doing shit like writing half-assed code to silence out or add tones to sections of PCM data. But I kinda do miss it at the same time lol.
 

shiv

John
Administrator
Founder
Member
Joined
Dec 1, 2020
Messages
13,741
This brings back some memories. I used to work for a speech analytics company. I don't miss doing shit like writing half-assed code to silence out or add tones to sections of PCM data. But I kinda do miss it at the same time lol.
Could you expound? I’ve never heard of a speech analytics company
 

Hoppo

Elite
Founder
Joined
Jan 12, 2021
Messages
896
Could you expound? I’ve never heard of a speech analytics company
Our primary customers were call centers. We would take their recorded calls, run them through the transcriber software to convert the speech to text, then perform analytics on the resulting text data. Several customers used it for agent coaching, augmenting what supervisors would do (we'd mine 100% of their audio versus the old model of a supervisor doing spot checks on random calls). They could define their own patterns to search for, and we had built-in ones that would identify customer churn, rude agents, rude customers, competitor mentions, etc. Though I'd say our biggest use case while I was there was creditor compliance. I think the majority of our customers at the time were debt collection agencies, so we had predefined patterns that would highlight noncompliant calls. If they could get in front of those issues they could head off big fines from the feds, so that was a particularly high-value use case.
 

shiv

John
Administrator
Founder
Member
Joined
Dec 1, 2020
Messages
13,741
Our primary customers were call centers. We would take their recorded calls, run them through the transcriber software to convert the speech to text, then perform analytics on the resulting text data. Several customers used it for agent coaching, augmenting what supervisors would do (we'd mine 100% of their audio versus the old model of a supervisor doing spot checks on random calls). They could define their own patterns to search for, and we had built-in ones that would identify customer churn, rude agents, rude customers, competitor mentions, etc. Though I'd say our biggest use case while I was there was creditor compliance. I think the majority of our customers at the time were debt collection agencies, so we had predefined patterns that would highlight noncompliant calls. If they could get in front of those issues they could head off big fines from the feds, so that was a particularly high-value use case.
Very interesting (to me at least).

One idea that was enlightening to me about voice/pressure waves was:

Let’s say a couple people in a kitchen are talking, and there is a big of chips on the table. You want to understand what they are saying, but you are 500 yards away with no microphone. If you can get a high res / high speed camera on that bag of chips, you can convert very tiny movements on that bag detected by the camera into speech.

Combine those ideas with how many cameras and microphones are everywhere, how easy it is to convert “pressure waves” to text, you can basically figure out anything said anywhere and store it. The big challenge now is there is just so much data to process, but as the tools progress no one will have any secrets that aren’t known on a raid somewhere unless they are very careful
 
Top Bottom